
Water Level Controller for Multiple Tanks
- Ramesh G

- Dec 26, 2021
- 3 min read
Updated: Dec 27, 2021
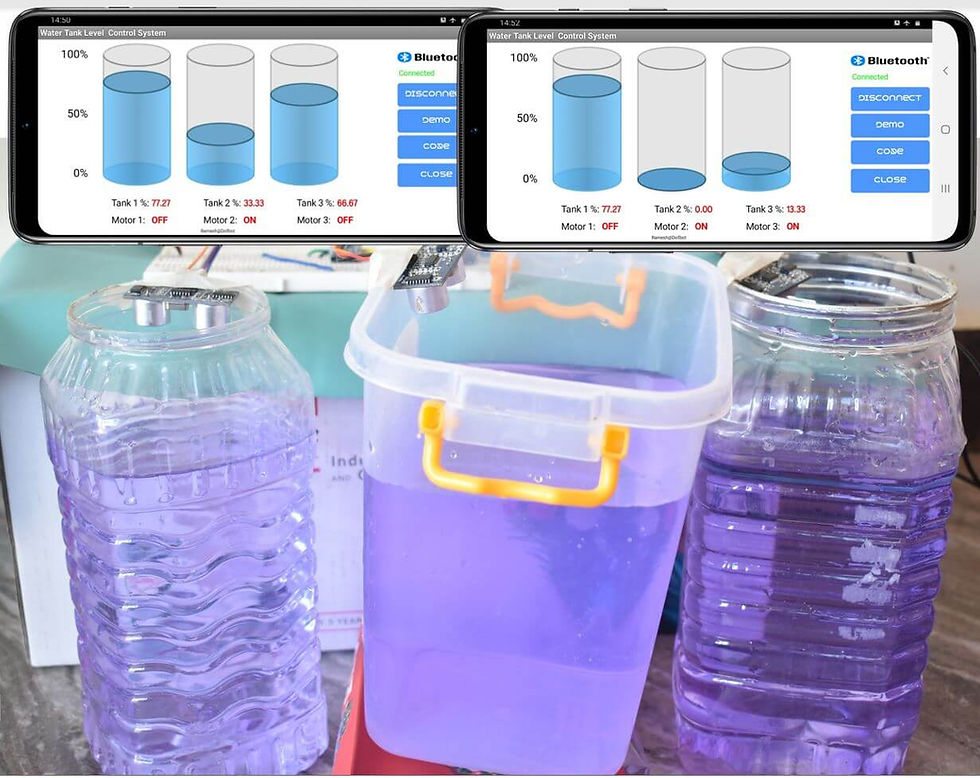
Learn here to create Arduino Based Water Level controller with bluetooth. We’ll use the HC SR04 ultrasonic to measure tank level, Bluetooth send water level percentage and Pump motor ON/OFF status data to android application for HTML Java script Tank Gauge display.
Components required
Arduino Nano - 1 no
HC SR04 - 3 no
Bluetooth HC-05 - 1 no
Jumper wires
Circuit diagram

Refer to project Water level controller with Real time data logger for more detail.

Installing arduino Library
Download Ultrasonic library , we need to use this library.
Follow the next steps to install those libraries.
In your Arduino IDE, to install the libraries go to Sketch > Include Library > Add .ZIP library… and select the library you’ve just downloaded.
After installing the required libraries, copy the following code to your Arduino IDE.


Arduino Code:
#include <Ultrasonic.h>
Ultrasonic ultrasonic1(2, 3);
Ultrasonic ultrasonic2(4, 5);
Ultrasonic ultrasonic3(8, 9);
// Tank T1
int T1distance;
int T1Lowlevel = 20; // Tank1 Pump ON - T1Percentage 20% you can change the value as per your need
int T1Highlevel = 70; // Tank 1Pump OFF - T1Percentage 70% you can change the value as per your need
int T1TankHeight = 22; // Tank1 Manually enter Tank height in cm
float T1Percentage,T1Math;
#define T1MOTORPIN 6 // Tank 1 Pump relay
/////
// Tank T2
int T2distance;
int T2Lowlevel = 20; // Tank 2 Pump ON - T1Percentage 20% you can change the value as per your need
int T2Highlevel = 70; // Tank 2 Pump OFF - T1Percentage 70% you can change the value as per your need
int T2TankHeight = 18; // Tank 2 Manually enter Tank height in cm
float T2Percentage,T2Math;
#define T2MOTORPIN 7 // Tank 2 Pump relay
/////
// Tank T3
int T3distance;
int T3Lowlevel = 20; // Tank 3 Pump ON - T1Percentage 20% you can change the value as per your need
int T3Highlevel = 70; // Tank 3 Pump OFF - T1Percentage 70% you can change the value as per your need
int T3TankHeight = 15; // Tank 3 Manually enter Tank height in cm
float T3Percentage,T3Math;
#define T3MOTORPIN 10 // Tank 3 Pump relay
////
String Data;
void setup() {
Serial.begin(9600);
Serial.setTimeout(100);
pinMode(T1MOTORPIN,OUTPUT);// Relay pin as output pin
pinMode(T2MOTORPIN,OUTPUT);// Relay pin as output pin
pinMode(T3MOTORPIN,OUTPUT);// Relay pin as output pin
// digitalWrite(MOTORPIN,LOW); // unslash Start Up Turn off the relay condition
// digitalWrite(MOTORPIN,High); //unslash Start Up Turn ON the relay condition
delay(1000);
}
void loop() {
// Tank 1 loop
T1distance = ultrasonic1.read();
T1Math = T1TankHeight-T1distance;
T1Percentage = (T1Math/T1TankHeight)*100;
if ((T1Percentage >= 0) && (T1Percentage <= 100))
if(T1Percentage <= T1Lowlevel) // Relay ON when reached Low Level point
{digitalWrite(T1MOTORPIN,HIGH);}
if(T1Percentage >= T1Highlevel) // Relay OFF when reached High Level point
{digitalWrite(T1MOTORPIN,LOW);}
// end
// Tank 2 loop
T2distance = ultrasonic2.read();
T2Math = T2TankHeight-T2distance;
T2Percentage = (T2Math/T2TankHeight)*100;
if ((T2Percentage >= 0) && (T2Percentage <= 100))
if(T2Percentage <= T2Lowlevel) // Relay ON when reached Low Level point
{digitalWrite(T2MOTORPIN,HIGH);}
if(T2Percentage >= T2Highlevel) // Relay OFF when reached High Level point
{digitalWrite(T2MOTORPIN,LOW);}
// end
// Tank 3 loop
T3distance = ultrasonic3.read();
T3Math = T3TankHeight-T3distance;
T3Percentage = (T3Math/T3TankHeight)*100;
if ((T3Percentage >= 0) && (T3Percentage <= 100))
if(T3Percentage <= T3Lowlevel) // Relay ON when reached Low Level point
{digitalWrite(T3MOTORPIN,HIGH);}
if(T3Percentage >= T3Highlevel) // Relay OFF when reached High Level point
{digitalWrite(T3MOTORPIN,LOW);}
// end
Data = (String)T1Percentage+":"+(String)T2Percentage+":"+(String)T3Percentage+ ":"+(String)(digitalRead(T1MOTORPIN))+":"+(String)(digitalRead(T2MOTORPIN))+":"+(String)(digitalRead(T3MOTORPIN));
Serial.println(Data);
delay(5000);
}
Serial Monitor
After a successful upload, open the Serial Monitor at a baud rate of 9600. Press the “EN/RST” button on the Arduino Uno board and see the Tank percentage and Pump ON/OFF status for each tanks in Serial monitor.

Android Application
First open Mobile application and select Bluetooth image button, after that select Bluetooth HC-05 device to connect and enter Password as mentioned above (0000 or 1234).

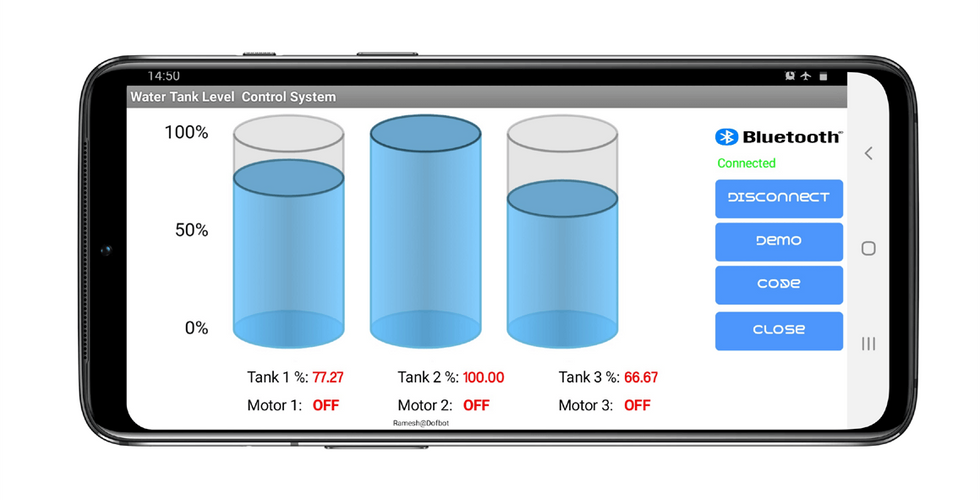


Here to used amChart for Tank Level data visualization.
HTML code for Multiple tanks, referf below.
<!-- Styles -->
<style>
width: 100%;
height: 500px;
}
</style>
<!-- Resources -->
<script src="https://cdn.amcharts.com/lib/4/core.js"></script>
<script src="https://cdn.amcharts.com/lib/4/charts.js"></script>
<script src="https://cdn.amcharts.com/lib/4/themes/animated.js"></script>
<!-- Chart code -->
<script>
am4core.ready(function() {
// Themes begin
am4core.useTheme(am4themes_animated);
// Themes end
// Create chart instance
var chart = am4core.create("chartdiv", am4charts.XYChart3D);
chart.titles.create().text = "Crude oil reserves";
// Add data
chart.data = [{
"category": "2018 Q1",
"value1": 30,
"value2": 70
}, {
"category": "2018 Q2",
"value1": 15,
"value2": 85
}, {
"category": "2018 Q3",
"value1": 40,
"value2": 60
}, {
"category": "2018 Q4",
"value1": 55,
"value2": 45
}];
// Create axes
var categoryAxis = chart.xAxes.push(new am4charts.CategoryAxis());
categoryAxis.dataFields.category = "category";
categoryAxis.renderer.grid.template.location = 0;
categoryAxis.renderer.grid.template.strokeOpacity = 0;
var valueAxis = chart.yAxes.push(new am4charts.ValueAxis());
valueAxis.renderer.grid.template.strokeOpacity = 0;
valueAxis.min = -10;
valueAxis.max = 110;
valueAxis.strictMinMax = true;
valueAxis.renderer.baseGrid.disabled = true;
valueAxis.renderer.labels.template.adapter.add("text", function(text) {
if ((text > 100) || (text < 0)) {
return "";
}
else {
return text + "%";
}
})
// Create series
var series1 = chart.series.push(new am4charts.ConeSeries());
series1.dataFields.valueY = "value1";
series1.dataFields.categoryX = "category";
series1.columns.template.width = am4core.percent(80);
series1.columns.template.fillOpacity = 0.9;
series1.columns.template.strokeOpacity = 1;
series1.columns.template.strokeWidth = 2;
var series2 = chart.series.push(new am4charts.ConeSeries());
series2.dataFields.valueY = "value2";
series2.dataFields.categoryX = "category";
series2.stacked = true;
series2.columns.template.width = am4core.percent(80);
series2.columns.template.fill = am4core.color("#000");
series2.columns.template.fillOpacity = 0.1;
series2.columns.template.stroke = am4core.color("#000");
series2.columns.template.strokeOpacity = 0.2;
series2.columns.template.strokeWidth = 2;
}); // end am4core.ready()
</script>
<!-- HTML -->
<div id="chartdiv"></div>


コメント