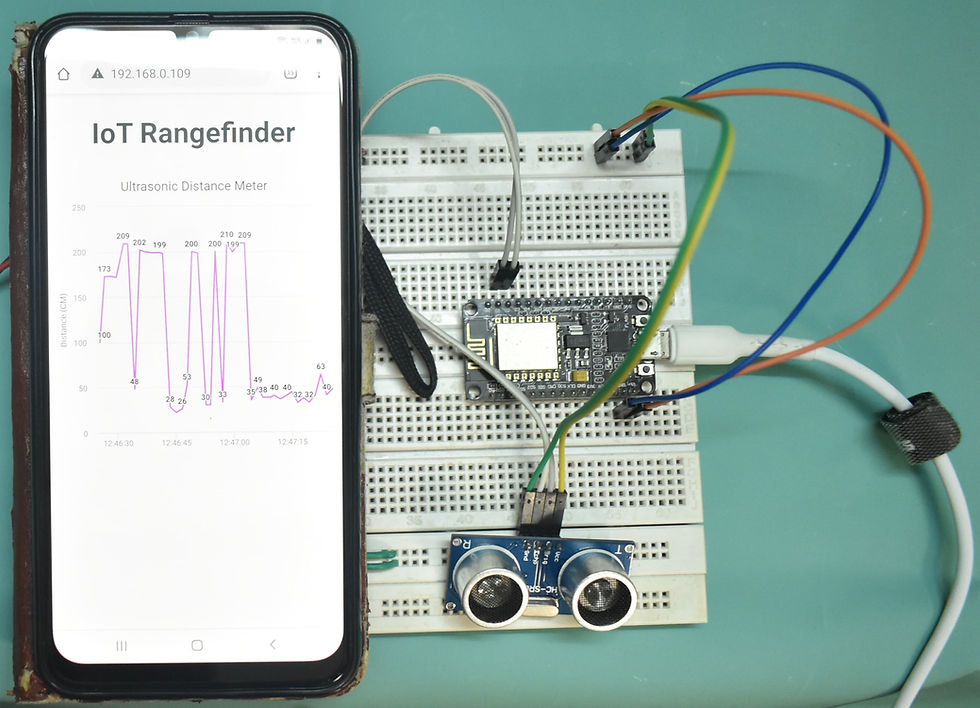
Here to learn how to find distance and Plot the Sensor readings to Webserver in Real-Time Chart using the ESP8266 and ultrasonic sensor. The ESP8266 will host a web page with real-time graph that have new readings added every 1.5 seconds and to keep refreshing the page to read new readings.

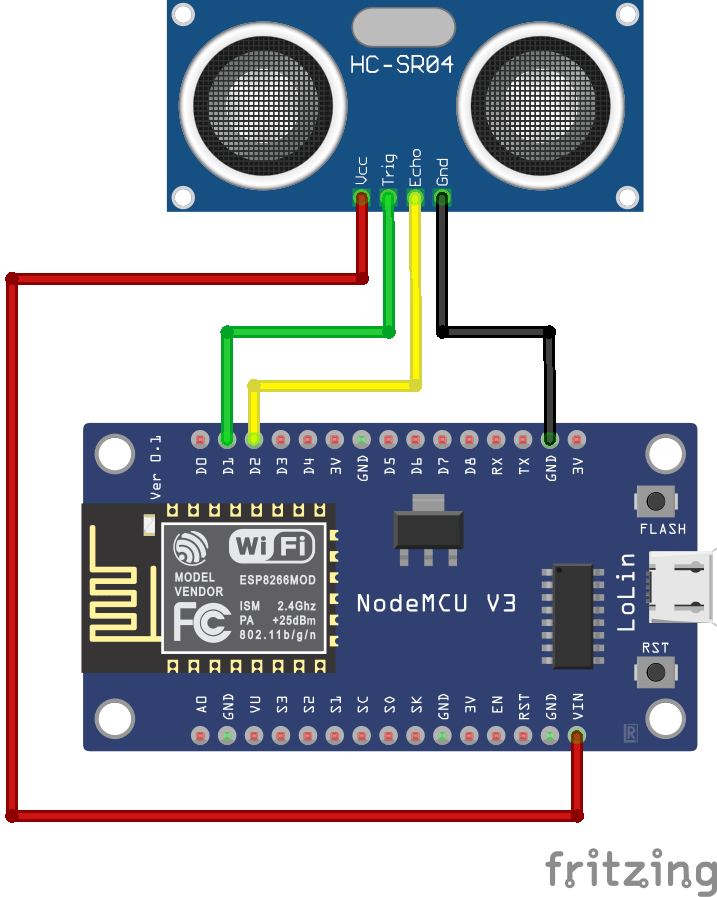
Circuit Diagram

Components Required
To make this project you need the following components:
ESP8266 Development Board
HC-SR04 Ultrasonic sensor
Breadboard
Jumper wires
Ultrasonic HC-SR04 wiring to ESP8266
Ultrasonic HC-SR04 ESP8266
Vcc Pin Vin Pin
Trig Pin D1 (GPIO 5)
Echo Pin D2 (GPIO 4)
GND Pin GND

Install ESP8266 Board in Arduino IDE
First of All, we’ll program ESP8266 using Arduino IDE.
Filesystem Uploader Plugin
Secondly, we are uploading an HTML file to ESP8266 flash memory. Hence, we’ll need a plugin for Arduino IDE called Filesystem uploader. Follow this -https://www.dofbot.com/post/esp8266-spiffs-uploader tutorial to install a filesystem uploader for ESP8266. Install FileSystem Uploader Plugin in Arduino IDE
Installing Libraries
Thirdly, to run the asynchronous web server, you need to install the following libraries.
ESP8266 Board: you need to Download and install the ESPAsyncWebServer and the ESPAsyncTCP libraries.
These libraries aren’t available on the Arduino Library Manager, so you need to download and copy the library files to the Arduino Installation folder.
To get readings from the Ultrasonic HC-SR04 sensor module you need to have the next library installed:
Download Ultrasonic Library
Finally, to build the web server we need two different files. One is The Arduino sketch and the other is an HTML file. So, the HTML file should be saved inside a folder called data. It resides inside the Arduino sketch folder, as shown below:
Creating the HTML File
Create an index.html file with the following content.
<!DOCTYPE HTML><html>
<head>
<meta name="viewport" content="width=device-width, initial-scale=1">
<script src="https://code.highcharts.com/highcharts.js"></script>
<style>
body {
min-width: 310px;
max-width: 800px;
height: 400px;
margin: 0 auto;
}
h2 {
font-family: Arial;
font-size: 2.5rem;
text-align: center;
}
</style>
</head>
<body>
<h2>IOT RangeFinder</h2>
<div id="chart-distance" class="container"></div>
</body>
<script>
var chartT = new Highcharts.Chart({
chart:{ renderTo : 'chart-distance' },
title: { text: 'ULTRASONIC HC-SR04 Realtime Distance Meter' },
series: [{
showInLegend: false,
data: []
}],
plotOptions: {
line: { animation: false,
dataLabels: { enabled: true }
},
series: { color: '#cb07e8' }
},
xAxis: { type: 'datetime',
dateTimeLabelFormats: { second: '%H:%M:%S' }
},
yAxis: {
title: { text: 'Distance (CM)' }
},
credits: { enabled: false }
});
setInterval(function ( ) {
var xhttp = new XMLHttpRequest();
xhttp.onreadystatechange = function() {
if (this.readyState == 4 && this.status == 200) {
var x = (new Date()).getTime(),
y = parseFloat(this.responseText);
//console.log(this.responseText);
if(chartT.series[0].data.length > 40) {
chartT.series[0].addPoint([x, y], true, true, true);
} else {
chartT.series[0].addPoint([x, y], true, false, true);
}
}
};
xhttp.open("GET", "/distance", true);
xhttp.send();
}, 500 ) ;
</script>
</html>
The index.html file will contain web pages that will be displayed by the server along with JavaScript that will process the formation of graphics. While all server programs and sensor readings are in the .ino file.
The code explains that a new Highcharts object was formed to be rendered to the <div> tag with the chart-distance id in the HTML code. Then, the X-axis is defined as the time of reading the data, and the Y-axis is the value of the reading which is the distance in centimeters (cm). Then, the set Interval function will send data from the server every 1.5 seconds by accessing the “/ distance”endpoint provided by the server and sending the data to the chart object earlier.
arduino code:
#include <Ultrasonic.h>
#include <ESP8266WiFi.h>
#include <ESPAsyncTCP.h>
#include <ESPAsyncWebServer.h>
#include <FS.h>
#include <Wire.h>
// Instantiate trig and echo pins for ultrasonic sensors
Ultrasonic ultrasonic (D1, D2);
// Replace with your network credentials
const char* ssid = "TP-Link_3200"; // your SSID
const char* password = "9500112137"; // Your Wifi password
// Create AsyncWebServer object on port 80
AsyncWebServer server(80);
String getDistance() {
// Read Distance
float d = ultrasonic.read();
if (isnan(d)) {
Serial.println("Failed to read from HC-SR04 sensor!");
return "";
}
else {
Serial.println(d);
return String(d);
}
}
void setup () {
// Serial port for debugging purposes
Serial.begin (115200);
lcd.init(); // initialize the lcd
// Print a message to the LCD.
lcd.backlight();
// Initialize SPIFFS
if (! SPIFFS.begin ()) {
Serial.println ("An Error has occurred while mounting SPIFFS");
return;
}
// Connect to Wi-Fi
WiFi.begin(ssid, password);
while (WiFi.status() != WL_CONNECTED) {
delay(1000);
Serial.println("Connecting to WiFi..");
}
// Print ESP32 Local IP Address
Serial.println(WiFi.localIP());
// Route for web page
server.on ("/", HTTP_GET, [] (AsyncWebServerRequest * request) {
request-> send (SPIFFS, "/index.html");
});
server.on ("/distance", HTTP_GET, [] (AsyncWebServerRequest * request) {
request-> send_P (200, "text / plain", getDistance(). c_str ());
});
// start server
server.begin ();
}
void loop() {
}
Then, upload the code to your NodeMCU board. Make sure you have selected the right board and COM port. Also, make sure you’ve inserted your WiFi Credentials in the code.
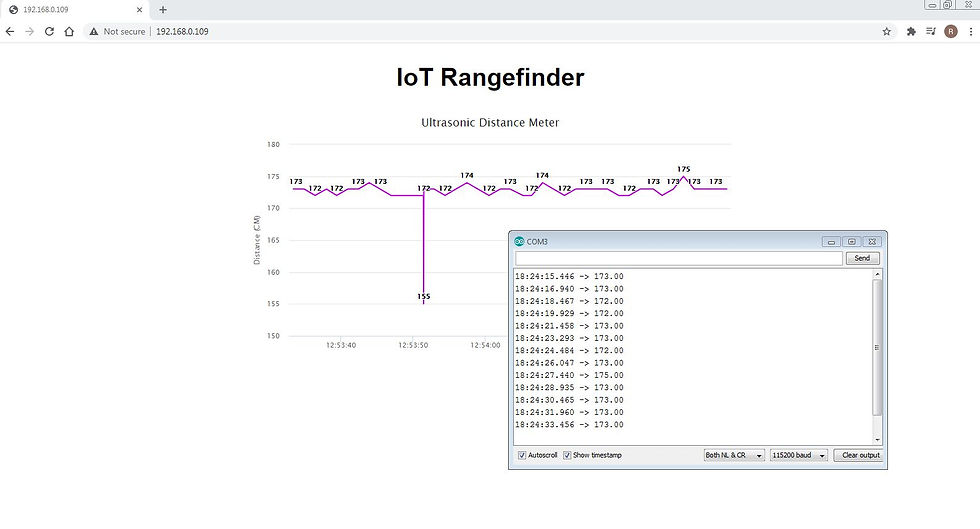
After a successful upload, open the Serial Monitor at a baud rate of 115200. Press the “EN/RST” button on the ESP8266 board. Now it should print its IP address.


Result
Open web browser and type the ESP8266 local IP address. Now you should see the Rangefinder plot meter.

Comments