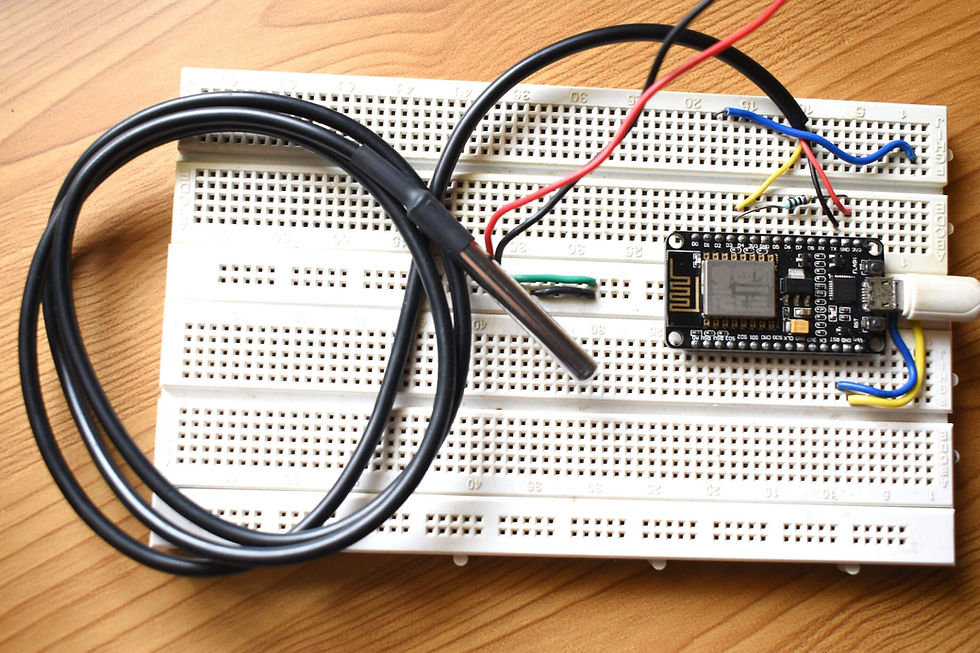
ESP8266 Webserver based Thermometer using DS18B20 and Fusion charts
- Ramesh G
- Oct 24, 2022
- 3 min read

In this tutorial, we will learn to create an ESP8266 NodeMCU web server using DS18B20 and Fusion charts widget. The chip DS18B20 is used to measure temperature in Celsius and Fahrenheit. This web server will act as a weather station as it will show fusion charts widget thermometer gauge readings will update in Celsius and Fahrenheit automatically on the web page.
Circuit Diagram

Components Required
DS18B20 - 1no
Node MCU ESP8266 12E Dev Module- 1 no
Resistor 4.7K- 1 no
Jumper wires

DS18B20
DS18B20 is a temperature sensor of Maxim. The single-chip microcomputer can communicate with DS18B20 through 1-Wire protocol and finally read the temperature. The hardware interface of the 1-Wire bus is very simple, just connect the data pin of DS18B20 to an IO port of the microcontroller.

Installing the library
To install the library navigate to the Sketch > Include Library > Manage Libraries… Wait for Library Manager to download libraries index and update list of installed libraries.
To interface with the DS18B20 temperature sensor, you need to install the One Wire library .
Open your Arduino IDE and go to Sketch > Include Library > Manage Libraries. The Library Manager should open. Type “onewire” in the search box and install the OneWire library by Paul Stoffregen.
Download Dallas Library , we need to use this library for temperature measurement.
In your Arduino IDE, to install the libraries go to Sketch > Include Library > Add .ZIP library… and select the library you’ve just downloaded.
After installing the required libraries, copy the following code to your Arduino IDE.
arduino code
#include <ESP8266WiFi.h>
#include <ESP8266WebServer.h>
// Include the libraries we need
#include <OneWire.h>
#include <DallasTemperature.h>
// Data wire is plugged into port 2 on the Arduino
#define ONE_WIRE_BUS 2
// Setup a oneWire instance to communicate with any OneWire devices (not just Maxim/Dallas temperature ICs)
OneWire oneWire(ONE_WIRE_BUS);
// Pass our oneWire reference to Dallas Temperature.
DallasTemperature sensors(&oneWire);
//WiFi Connection configuration
const char* ssid = "TP-Link_3200"; //YOUR SSID
const char* password = "95001121379884265554"; //YOUR WIFI PASSWORD
const char index_html[] PROGMEM={"<!DOCTYPE html>\n"
"<html>\n"
"<head>\n"
"<title>IOT Based Temperature Monitor</title>\n"
"<head>\n"
"<body>\n"
"<h1>ESP8266 NodeMCU DS18B20 Thermometer Display</h1>"
"<body>\n"
"<script type=\"text/javascript\" src=\"http://static.fusioncharts.com/code/latest/fusioncharts.js\"></script>\n"
"<script type=\"text/javascript\" src=\"http://static.fusioncharts.com/code/latest/themes/fusioncharts.theme.fusion.js\"></script>\n"
"<script src=\"https://cdnjs.cloudflare.com/ajax/libs/zepto/1.2.0/zepto.min.js\"></script>\n"
"<script>\n"
" </script>\n"
"\t\n"
"<script type=\"text/javascript\">\n"
" FusionCharts.ready(function(){\n"
" var chartObj = new FusionCharts({\n"
" \"type\": \"thermometer\",\n"
" \"dataFormat\": \"json\",\n"
" \"renderAt\": \"chart-container\",\n"
" \"id\": \"myThm\",\n"
" \"width\": \"250\",\n"
" \"height\": \"500\",\n"
" \"dataSource\": {\n"
" \"chart\": {\n"
" \"theme\": \"fusion\",\n"
" \"caption\": \"Celcsius\",\n"
" \"lowerLimit\": \"0\",\n"
" \"upperLimit\": \"100\",\n"
" \"numberSuffix\": \" °C \",\n"
" \"decimals\": \" 1 \",\n"
" \"showhovereffect\": \"1\",\n"
" \"gaugeFillColor\": \"#00bfff\",\n"
" \"thmOriginX\": \"100\",\n"
" \"theme\": \"umber\",\n"
" \"chartBottomMargin\": \"20\",\n"
" \"adjustTM\": \"1\",\n"
" \"ticksOnRight\": \"0\",\n"
" \"tickMarkDistance\": \"5\",\n"
" \"tickValueDistance\": \"2\",\n"
" \"majorTMNumber\": \"9\",\n"
" \"majorTMHeigh\": \"12\",\n"
" \"minorTMNumber\": \"9\",\n"
" \"minorTMHeight\": \"7\",\n"
" \"tickValueStep\": \"1\"\n"
" },\n"
" \"value\": \"0\"\n"
" },\n"
" \"events\": {\n"
" \"rendered\": function(evtObj, argObj) {\n"
"\tsetInterval(function() {\n"
"\tvar someUrl = \"/tempC\";\n"
"\t\t\t\t\t$.ajax({\n"
"\t\t\t\t\t\turl: someUrl,\n"
"\t\t\t\t\t\tdataType: \"text\",\n"
"\t\t\t\t\t\tsuccess: function(response) {\n"
"\t\t\t\t\t\t\t evtObj.sender.feedData(\"&value=\" + response);\n"
"\t\t\t\t\t\t},\n"
"\t\t\t\t\t\ttimeout: 1000\n"
"\t\t\t\t\t})\t\n"
"\t\t\n"
" }, 1000); \n"
" }\n"
"}\n"
"});\n"
" chartObj.render();\n"
" });\n"
" FusionCharts.ready(function(){\n"
" var chartObj2 = new FusionCharts({\n"
" \"type\": \"thermometer\",\n"
" \"dataFormat\": \"json\",\n"
" \"renderAt\": \"chart-container2\",\n"
" \"id\": \"myThm\",\n"
" \"width\": \"250\",\n"
" \"height\": \"500\",\n"
" \"dataSource\": {\n"
" \"chart\": {\n"
" \"theme\": \"fusion\",\n"
" \"caption\": \"Fahrenheit\",\n"
" \"lowerLimit\": \"32\",\n"
" \"upperLimit\": \"212\",\n"
" \"numberSuffix\": \" °F \",\n"
" \"decimals\": \" 1 \",\n"
" \"showhovereffect\": \"1\",\n"
" \"gaugeFillColor\": \"#0000FF\",\n"
" \"thmOriginX\": \"100\",\n"
" \"theme\": \"umber\",\n"
" \"chartBottomMargin\": \"20\",\n"
" \"adjustTM\": \"1\",\n"
" \"ticksOnRight\": \"0\",\n"
" \"tickMarkDistance\": \"5\",\n"
" \"tickValueDistance\": \"1\",\n"
" \"majorTMNumber\": \"9\",\n"
" \"majorTMHeigh\": \"12\",\n"
" \"minorTMNumber\": \"9\",\n"
" \"minorTMHeight\": \"7\",\n"
" \"tickValueStep\": \"1\"\n"
" },\n"
" \"value\": \"0\"\n"
" },\n"
" \"events\": {\n"
" \"rendered\": function(evtObj, argObj) {\n"
"\tsetInterval(function() {\n"
"\tvar someUrl = \"/tempF\";\n"
"\t\t\t\t\t$.ajax({\n"
"\t\t\t\t\t\turl: someUrl,\n"
"\t\t\t\t\t\tdataType: \"text\",\n"
"\t\t\t\t\t\tsuccess: function(response) {\n"
"\t\t\t\t\t\t\t evtObj.sender.feedData(\"&value=\" + response);\n"
"\t\t\t\t\t\t},\n"
"\t\t\t\t\t\ttimeout: 1000\n"
"\t\t\t\t\t})\t\n"
"\t\t\n"
" }, 1000); \n"
" }\n"
"}\n"
"});\n"
" chartObj2.render();\n"
" });\n"
"</script>\n"
"</head>\n"
"<body>\n"
"<div style=\"width:600px;margin:auto;\">\n"
"\n"
" </main>\n"
" \n"
"</div>\n"
" <span style=\"margin-left: 10px;\" class=\"outline\" id=\"chart-container\">FusionCharts XT will load here!</span>\n"
" <span style=\"margin-left: 10px;\" class=\"outline\" id=\"chart-container2\">FusionCharts XT will load here!</span>\n"
" </div>\n"
"\n"
"\n"
"\t</body>\n"
"</html>"
};
ESP8266WebServer server(80);
void handleRoot() {
server.send_P(200, "text/html;charset=UTF-8", index_html);
}
void handleCTempRequest(){
sensors.requestTemperatures(); // Send the command to get temperatures
Serial.println("Temperature is: ");
float tempC = (sensors.getTempCByIndex(0));
Serial.println(tempC);
//delay(1000);
server.send(200,"text",String(tempC));
}
void handleFTempRequest(){
sensors.requestTemperatures(); // Send the command to get temperatures
float tempC = (sensors.getTempCByIndex(0));
// float tempF = (DallasTemperature::toFahrenheit(tempC));
float tempF = (sensors.getTempFByIndex(0));
Serial.println("Fahrenheit is: ");
Serial.println(tempF);
//delay(1000);
server.send(200,"text",String(tempF));
}
void handleNotFound(){
String message = "File Not Found\n\n";
server.send(404, "text/plain", message);
}
void runPeriodicFunc(){
static const unsigned long REFRESH_INTERVAL1 = 1000; //
static unsigned long lastRefreshTime1 = 0;
if(millis() - lastRefreshTime1 >= REFRESH_INTERVAL1)
{
lastRefreshTime1 = millis();
}
}
void setup(void){
// start serial port
Serial.begin(115200);
sensors.begin();
delay(100);
WiFi.begin(ssid, password);
Serial.println("");
while (WiFi.status() != WL_CONNECTED) {
delay(500);
Serial.print(".");
}
Serial.print("IP address:");
Serial.println(WiFi.localIP());
server.on("/", handleRoot);
server.on("/tempC",handleCTempRequest);
server.on("/tempF",handleFTempRequest);
server.onNotFound(handleNotFound);
server.begin();
delay(2000);
Serial.println("HTTP server started");
}
void loop(void){
runPeriodicFunc();
server.handleClient();
// sensors.requestTemperatures(); // Send the command to get temperatures
// float tempC = (sensors.getTempCByIndex(0));
// float tempF = (DallasTemperature::toFahrenheit(tempC));
}
After a successful upload, open the Serial Monitor at a baud rate of 9600. Press the “EN/RST” button on the ESP8266 board and see the result in serial monitor.

After that Open the web browser and enter the IP address path for Thermometer reading on Fusion chart Gauge.

Demo:


Komentarze