ESP32 DHT Weather Monitor with 3.5inch TFT touch Display
- Ramesh G
- Mar 12, 2023
- 11 min read
Updated: Sep 18, 2024

In this tutorial, I 'll Published an ESP32 based webserver to display the temperature and humidity values from the DHT11 sensor. ESP32 board will read the temperature and humidity data from the DHT11 sensor and display it on the Webpage and 3.5inch TFT Display. The 3.5″ TFT Touch Screen Display uses an ILI9488 TFT LCD Driver. The screen resolution is 320×480.

Components Required
ESP-32 Module (38Pin)
DHT11 Sensor Module
3.5 inch TFT LCD Display Module SPI Interface 320x480 with Touch Screen
Jumper Wires
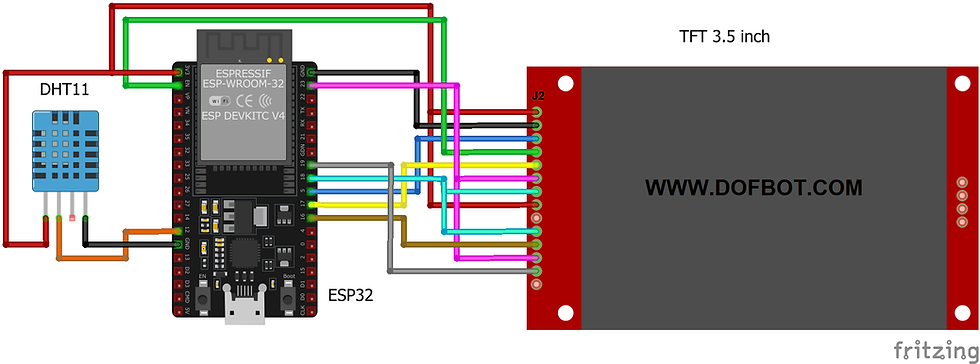
Circuit Diagram

ESP32 Development Board WiFi+Bluetooth 38 Pin
ESP32 Development board is based on the ESP WROOM32 WIFI + BLE Module.It’s a low-footprint, minimal system development board powered by the latest ESP-WROOM-32 module and can be easily inserted into a solderless breadboard. It contains the entire basic support circuitry for the ESP-WROOM-32, including the USB-UART bridge, reset- and boot-mode buttons, LDO regulator and a micro-USB connector. Every important GPIO is available to the developer.

ESP32 Development Board Feature: ESP32 is already integrated antenna and RF balun,power amplifier,low-noise amplifiers,filters,and power management module. This board is used with 2.4 GHz dual-mode Wi-Fi and Bluetooth chips by TSMC 40nm low power technology,power and RF properties best,which is safe,reliable,and scalable to a variety of applications. Strong function with support LWIP protocol,Freertos. Supporting three modes:AP,STA,and AP+STA. Supporting Lua program,easily to develop.
3.5 inch TFT LCD Display Module SPI Interface 320x480 with Touch Screen

This TFT display is big bright and colorful! 480×320 pixels with individual RGB pixel control, this has way more resolution than a black and white 128×64 display.
As a bonus, this display has a resistive touch screen attached to it already, so you can detect finger presses anywhere on the screen. This display has a controller built into it with RAM buffering so that almost no work is done by the microcontroller.

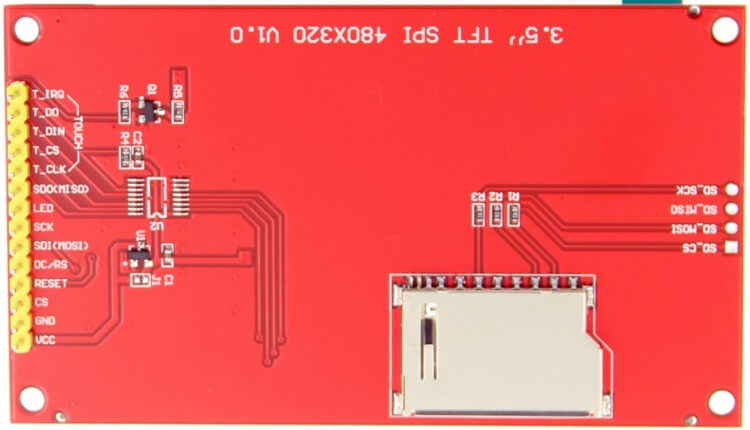
This 3.5-inch SPI Touch Screen Module is wrapped up into an easy-to-use breakout board, with SPI connections on one end. If you’re going with SPI mode, you can also take advantage of the onboard MicroSD card socket to display images.
The 3.5-inch display doesn't have a built-in level shifter, so it's advised to use only 3.3v. Using a node MCU would be more suitable cause it provides only 3.3v. if you are using a 5v microcontroller like the Arduino UNO, MEGA, Using a level shifter would give you the appropriate voltage needed to operate the LCD without damaging it.
Specifications:
3.5-inch color screen,support 65K color display,display rich colors
Touch: Resistive
Display Size: 3.5 inch
Operating Voltage (V): 3.3 to 5V
SPI Signal Voltage (V): 3.3 to 5V
Display Driver IC: ILI9488
Touch Driver IC:
Color Depth: 262K/65K
Resolution (pixels): 320 x 480
Using the SPI serial bus, it only takes a few IOs to illuminate the display
Easy to expand the experiment with SD card slot
DATA SHEET Download
3.5 inch TFT LCD SPI Module Manual Download
Installing the library
To install the library navigate to the Sketch > Include Library > Manage Libraries… Wait for Library Manager to download libraries index and update list of installed libraries.
Download TFT Library , we need to use this library for TFT touch display
Download DHT Library , we need to use this library for Temperature sensor.
In your Arduino IDE, to install the libraries go to Sketch > Include Library > Add .ZIP library… and select the library you’ve just downloaded.
After Arduino IDE installed, there is no package to support ESP32-S2, we need to install the ESP32 package in Arduino IDE to continue.
Select “File>Preferences>settings>Additional Boards Manager URLs” to fill the link: https://raw.githubusercontent.com/espressif/arduino-esp32/gh-pages/package_esp32_dev_index.json


arduino code
#define RED2RED 0
#define GREEN2GREEN 1
#define BLUE2BLUE 2
#define BLUE2RED 3
#define GREEN2RED 4
#define RED2GREEN 5
#define TFT_GREY 0x2104 // Dark grey 16 bit colour
#include <TFT_eSPI.h> // Hardware-specific library
#include <SPI.h>
TFT_eSPI tft = TFT_eSPI(); // Invoke custom library with default width and height
uint32_t runTime = -99999; // time for next update
int reading = 0; // Value to be displayed
int reading2 = 0; // Value to be displayed
int d = 0; // Variable used for the sinewave test waveform
bool range_error = 0;
int8_t ramp = 1;
#include <WiFi.h>
const char* ssid = "TP-Link_3200"; // Your ssid
const char* password = "95001121379884265554"; // Your Password
char status;
WiFiServer server(80);
#include <DHT.h>
#define DHT_SENSOR_PIN 12 // ESP32 pin connected to DHT11 sensor
#define DHT_SENSOR_TYPE DHT11
DHT dht_sensor(DHT_SENSOR_PIN, DHT_SENSOR_TYPE);
void setup(void) {
tft.begin();
Serial.begin(9600);
dht_sensor.begin(); // initialize the DHT sensor
tft.setRotation(1);
tft.fillScreen(TFT_WHITE);
Serial.print("Connecting to ");
Serial.println(ssid);
WiFi.begin(ssid, password);
while (WiFi.status() != WL_CONNECTED) {
delay(500);
Serial.print(".");
}
Serial.println("");
Serial.println("WiFi is connected");
server.begin();
Serial.println("Server started");
Serial.println(WiFi.localIP());
delay(5000);
}
void loop() {
if (millis() - runTime >= 0L) { // Execute every TBD ms
runTime = millis();
// Test with a slowly changing value from a Sine function
//d += 4; if (d >= 360) d = 0;
// Set the the position, gap between meters, and inner radius of the meters
int xpos = 0, ypos = 5, gap = 4, radius = 52;
// Draw meter and get back x position of next meter
// Test with Sine wave function, normally reading will be from a sensor
//reading = 250 + 250 * sineWave(d+0);
//xpos = gap + ringMeter(reading, 0, 500, xpos, ypos, radius, "mA", GREEN2RED); // Draw analogue meter
//reading = 20 + 30 * sineWave(d+60);
//xpos = gap + ringMeter(reading, -10, 50, xpos, ypos, radius, "degC", BLUE2RED); // Draw analogue meter
//reading = 50 + 50 * sineWave(d + 120);
//ringMeter(reading, 0, 100, xpos, ypos, radius, "%RH", BLUE2BLUE); // Draw analogue meter
// Draw two more larger meters
//xpos = 20, ypos = 115, gap = 24, radius = 64;
//reading = 1000 + 150 * sineWave(d + 90);
//xpos = gap + ringMeter(reading, 850, 1150, xpos, ypos, radius, "mb", BLUE2RED); // Draw analogue meter
//reading = 15 + 15 * sineWave(d + 150);
//xpos = gap + ringMeter(reading, 0, 30, xpos, ypos, radius, "Volts", GREEN2GREEN); // Draw analogue meter
// read humidity
float humi = dht_sensor.readHumidity();
// read temperature in Celsius
float tempC = dht_sensor.readTemperature();
// read temperature in Fahrenheit
float tempF = dht_sensor.readTemperature(true);
// check whether the reading is successful or not
if ( isnan(tempC) || isnan(tempF) || isnan(humi)) {
Serial.println("Failed to read from DHT sensor!");
} else {
Serial.print("Humidity: ");
Serial.print(humi);
Serial.print("%");
Serial.print(" | ");
Serial.print("Temperature: ");
Serial.print(tempC);
Serial.print("°C ~ ");
Serial.print(tempF);
Serial.println("°F");
}
// Draw a large meter
xpos = 20, ypos = 30, gap = 2, radius = 100;
// reading +=(ramp);
// if (reading>98) ramp = -1;
// if (reading<0) ramp = 1;
reading = tempC;
// Comment out above meters, then uncomment the next line to show large meter
ringMeter(reading,0,100, xpos,ypos,radius,"°C",GREEN2GREEN); // Draw analogue meter
if (reading<0) delay(500);
tft.setCursor(10, 250, 4);
// Set the font colour to be white with a black background, set text size multiplier to 1
tft.setTextColor(TFT_BLACK,TFT_WHITE); tft.setTextSize(1);
// We can now plot text on screen using the "print" class
tft.drawString("`", 101, 186, 4); // prints °
tft.print("Temperature:");
tft.print(tempC);
tft.print(" ");
// Draw a large meter
xpos = 245, ypos = 30, gap = 2, radius = 100;
// reading +=(ramp);
// if (reading>98) ramp = -1;
// if (reading<0) ramp = 1;
reading2 = humi;
// Comment out above meters, then uncomment the next line to show large meter
ringMeter2(reading2,0,100, xpos,ypos,radius," %h",RED2RED); // Draw analogue meter
if (reading2<0) delay(500);
tft.setCursor(265, 250, 4);
// Set the font colour to be white with a black background, set text size multiplier to 1
tft.setTextColor(TFT_BLACK,TFT_WHITE); tft.setTextSize(1);
// We can now plot text on screen using the "print" class
// tft.drawString("`", 101, 186, 4); // prints °
tft.print("Humidity:");
tft.print(humi);
tft.print(" ");
}
// read humidity
float humi = dht_sensor.readHumidity();
// read temperature in Celsius
float tempC = dht_sensor.readTemperature();
WiFiClient client = server.available();
client.println("HTTP/1.1 200 OK");
client.println("Content-Type: text/html");
client.println("Connection: close"); // the connection will be closed after completion of the response
client.println("Refresh: 10"); // update the page after 10 sec
client.println();
client.println("<!DOCTYPE HTML>");
client.println("<html>");
client.println("<head>");
client.println("<style>html { font-family: Fantasy; display: block; margin: 0px auto; text-align: center;color: #6b4e4b; background-color: #fcffb3;}");
client.println("body{margin-top: 50px;}");
client.println("h1 {margin: 50px auto 30px; font-size: 50px; text-align: center;}");
client.println(".side_adjust{display: inline-block;vertical-align: middle;position: relative;}");
client.println(".text1{font-weight: 180; padding-left: 15px; font-size: 50px; width: 170px; text-align: left; color: #e8361e;}");
client.println(".data1{font-weight: 180; padding-left: 80px; font-size: 50px;color: #e8361e;}");
client.println(".text2{font-weight: 180; font-size: 50px; width: 170px; text-align: left; color: #1bf246;}");
client.println(".data2{font-weight: 180; padding-left: 150px; font-size: 50px;color: #1bf246;}");
client.println(".data{padding: 10px;}");
client.println("</style>");
client.println("</head>");
client.println("<body>");
client.println("<div id=\"webpage\">");
client.println("<h1>ESP32 Based Temperature & Humidity Data</h1>");
client.println("<div class=\"data\">");
client.println("<div class=\"side_adjust text2\">Temperature:</div>");
client.println("<div class=\"side_adjust data2\">");
client.print(tempC);
client.println("<div class=\"side_adjust text2\">°C</div>");
client.println("</div>");
client.println("<div class=\"data\">");
client.println("<div class=\"side_adjust text1\">Humidity:</div>");
client.println("<div class=\"side_adjust data1\">");
client.print(humi);
client.println("<div class=\"side_adjust text1\">%</div>");
client.println("</div>");
client.println("</div>");
client.println("</body>");
client.println("</html>");
}
// #########################################################################
// Draw the meter on the screen, returns x coord of righthand side
// #########################################################################
int ringMeter(int value, int vmin, int vmax, int x, int y, int r, const char *units, byte scheme)
{
// Minimum value of r is about 52 before value text intrudes on ring
// drawing the text first is an option
x += r; y += r; // Calculate coords of centre of ring
int w = r / 3; // Width of outer ring is 1/4 of radius
int angle = 150; // Half the sweep angle of meter (300 degrees)
int v = map(value, vmin, vmax, -angle, angle); // Map the value to an angle v
//int v = map(value, vmin, vmax, -angle, angle); // Map the value to an angle v
byte seg = 3; // Segments are 3 degrees wide = 100 segments for 300 degrees
byte inc = 3; // Draw segments every 3 degrees, increase to 6 for segmented ring
// Variable to save "value" text colour from scheme and set default
int colour = TFT_BLACK;
// Draw colour blocks every inc degrees
for (int i = -angle+inc/2; i < angle-inc/2; i += inc) {
// Calculate pair of coordinates for segment start
float sx = cos((i - 90) * 0.0174532925);
float sy = sin((i - 90) * 0.0174532925);
uint16_t x0 = sx * (r - w) + x;
uint16_t y0 = sy * (r - w) + y;
uint16_t x1 = sx * r + x;
uint16_t y1 = sy * r + y;
// Calculate pair of coordinates for segment end
float sx2 = cos((i + seg - 90) * 0.0174532925);
float sy2 = sin((i + seg - 90) * 0.0174532925);
int x2 = sx2 * (r - w) + x;
int y2 = sy2 * (r - w) + y;
int x3 = sx2 * r + x;
int y3 = sy2 * r + y;
if (i < v) { // Fill in coloured segments with 2 triangles
switch (scheme) {
case 0: colour = TFT_RED; break; // Fixed colour
case 1: colour = TFT_GREEN; break; // Fixed colour
case 2: colour = TFT_BLUE; break; // Fixed colour
default: colour = TFT_YELLOW; break; // Fixed colour
}
tft.fillTriangle(x0, y0, x1, y1, x2, y2, colour);
tft.fillTriangle(x1, y1, x2, y2, x3, y3, colour);
//text_colour = colour; // Save the last colour drawn
}
else // Fill in blank segments
{
tft.fillTriangle(x0, y0, x1, y1, x2, y2, TFT_GREY);
tft.fillTriangle(x1, y1, x2, y2, x3, y3, TFT_GREY);
}
}
// Convert value to a string
char buf[10];
byte len = 3; if (value > 999) len = 5;
dtostrf(value, len, 0, buf);
buf[len] = ' '; buf[len+1] = 0; // Add blanking space and terminator, helps to centre text too!
// Set the text colour to default
tft.setTextSize(1);
tft.setTextColor(TFT_WHITE, TFT_BLACK);
// Uncomment next line to set the text colour to the last segment value!
tft.setTextColor(colour, TFT_WHITE);
tft.setTextDatum(MC_DATUM);
// Print value, if the meter is large then use big font 8, othewise use 4
if (r > 84) {
tft.setTextPadding(25*3); // Allow for 3 digits each 55 pixels wide
tft.drawString(buf, x, y, 6); // Value in middle
}
else {
tft.setTextPadding(3 * 7); // Allow for 3 digits each 14 pixels wide
tft.drawString(buf, x, y, 6); // Value in middle
}
tft.setTextSize(1);
tft.setTextPadding(0);
// Print units, if the meter is large then use big font 4, othewise use 2
tft.setTextColor(TFT_BLACK,TFT_WHITE);
if (r > 84) tft.drawString(units, x, y + 60, 4); // Units display
else tft.drawString(units, x, y + 15, 2); // Units display
// Calculate and return right hand side x coordinate
return x + r;
}
// #########################################################################
// Draw the meter on the screen, returns x coord of righthand side
// #########################################################################
int ringMeter2(int value, int vmin, int vmax, int x, int y, int r, const char *units, byte scheme)
{
// Minimum value of r is about 52 before value text intrudes on ring
// drawing the text first is an option
x += r; y += r; // Calculate coords of centre of ring
int w = r / 3; // Width of outer ring is 1/4 of radius
int angle = 150; // Half the sweep angle of meter (300 degrees)
int v = map(value, vmin, vmax, -angle, angle); // Map the value to an angle v
//int v = map(value, vmin, vmax, -angle, angle); // Map the value to an angle v
byte seg = 3; // Segments are 3 degrees wide = 100 segments for 300 degrees
byte inc = 3; // Draw segments every 3 degrees, increase to 6 for segmented ring
// Variable to save "value" text colour from scheme and set default
int colour = TFT_BLACK;
// Draw colour blocks every inc degrees
for (int i = -angle+inc/2; i < angle-inc/2; i += inc) {
// Calculate pair of coordinates for segment start
float sx = cos((i - 90) * 0.0174532925);
float sy = sin((i - 90) * 0.0174532925);
uint16_t x0 = sx * (r - w) + x;
uint16_t y0 = sy * (r - w) + y;
uint16_t x1 = sx * r + x;
uint16_t y1 = sy * r + y;
// Calculate pair of coordinates for segment end
float sx2 = cos((i + seg - 90) * 0.0174532925);
float sy2 = sin((i + seg - 90) * 0.0174532925);
int x2 = sx2 * (r - w) + x;
int y2 = sy2 * (r - w) + y;
int x3 = sx2 * r + x;
int y3 = sy2 * r + y;
if (i < v) { // Fill in coloured segments with 2 triangles
switch (scheme) {
case 0: colour = TFT_RED; break; // Fixed colour
case 1: colour = TFT_GREEN; break; // Fixed colour
case 2: colour = TFT_BLUE; break; // Fixed colour
default: colour = TFT_YELLOW; break; // Fixed colour
}
tft.fillTriangle(x0, y0, x1, y1, x2, y2, colour);
tft.fillTriangle(x1, y1, x2, y2, x3, y3, colour);
//text_colour = colour; // Save the last colour drawn
}
else // Fill in blank segments
{
tft.fillTriangle(x0, y0, x1, y1, x2, y2, TFT_GREY);
tft.fillTriangle(x1, y1, x2, y2, x3, y3, TFT_GREY);
}
}
// Convert value to a string
char buf[10];
byte len = 3; if (value > 999) len = 5;
dtostrf(value, len, 0, buf);
buf[len] = ' '; buf[len+1] = 0; // Add blanking space and terminator, helps to centre text too!
// Set the text colour to default
tft.setTextSize(1);
tft.setTextColor(TFT_BLACK,TFT_WHITE);
// Uncomment next line to set the text colour to the last segment value!
tft.setTextColor(colour, TFT_WHITE);
tft.setTextDatum(MC_DATUM);
// Print value, if the meter is large then use big font 8, othewise use 4
if (r > 84) {
tft.setTextPadding(25*3); // Allow for 3 digits each 55 pixels wide
tft.drawString(buf, x, y, 6); // Value in middle
}
else {
tft.setTextPadding(3 * 7); // Allow for 3 digits each 14 pixels wide
tft.drawString(buf, x, y, 6); // Value in middle
}
tft.setTextSize(1);
tft.setTextPadding(0);
// Print units, if the meter is large then use big font 4, othewise use 2
tft.setTextColor(TFT_BLACK,TFT_WHITE);
if (r > 84) tft.drawString(units, x, y + 60, 4); // Units display
else tft.drawString(units, x, y + 15, 2); // Units display
// Calculate and return right hand side x coordinate
return x + r;
}
// #########################################################################
// Return a value in range -1 to +1 for a given phase angle in degrees
// #########################################################################
float sineWave(int phase) {
return sin(phase * 0.0174532925);
}
//====================================================================================
// This is the function to draw the icon stored as an array in program memory (FLASH)
//====================================================================================
// To speed up rendering we use a 64 pixel buffer
#define BUFF_SIZE 64
// Draw array "icon" of defined width and height at coordinate x,y
// Maximum icon size is 255x255 pixels to avoid integer overflow
void drawIcon(const unsigned short* icon, int16_t x, int16_t y, int8_t width, int8_t height) {
uint16_t pix_buffer[BUFF_SIZE]; // Pixel buffer (16 bits per pixel)
tft.startWrite();
// Set up a window the right size to stream pixels into
tft.setAddrWindow(x, y, width, height);
// Work out the number whole buffers to send
uint16_t nb = ((uint16_t)height * width) / BUFF_SIZE;
// Fill and send "nb" buffers to TFT
for (int i = 0; i < nb; i++) {
for (int j = 0; j < BUFF_SIZE; j++) {
pix_buffer[j] = pgm_read_word(&icon[i * BUFF_SIZE + j]);
}
tft.pushColors(pix_buffer, BUFF_SIZE);
}
// Work out number of pixels not yet sent
uint16_t np = ((uint16_t)height * width) % BUFF_SIZE;
// Send any partial buffer left over
if (np) {
for (int i = 0; i < np; i++) pix_buffer[i] = pgm_read_word(&icon[nb * BUFF_SIZE + i]);
tft.pushColors(pix_buffer, np);
}
tft.endWrite();
}
After a successful upload, open the Serial Monitor at a baud rate of 9600. Press the “EN/RST” button on the ESP32 board and see the IP address in serial monitor.

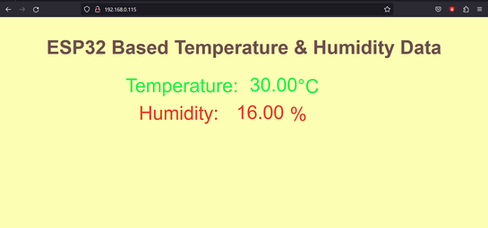
After that Open the web browser and enter the IP address path for DHT11 Weather data.


Comments